 If you’re involved in social media marketing for your business, you’re luckier than you think. We’ve got a whole host of great (and free) tools at our fingertips. For Facebook, Pinterest and Instagram, there are plenty of resources. But actually, the best analytics you can get your hands on are for Twitter.
From Twitter Analytics to Followerwonk, there are so many tools to help you look at the right numbers and make the right conclusions, simply and easily. Read on to see seven amazing things that the top three Twitter Analytics software sites can tell you. See if you can gain some insights from them too.
1. Your Dashboard
Twitter analytics gives you your data on a very deep and detailed level. On your main dashboard you will see:
- The number of tweets you’ve posted
- Your tweet impressions (the number of individual people who noticed your tweet)
- The amount of profile visits you’ve received
- Your mentions
- Your total number of followers
It then breaks this down month by month. So in each month you get to see your best tweet, top mention, top follower and top media tweet, along with stats for everything listed above.
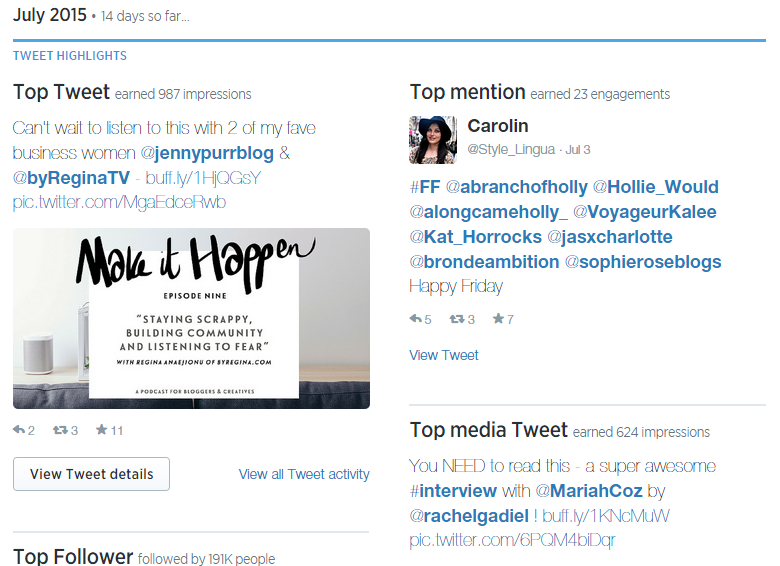
The reason why this information is so valuable is because it will help you to track your progress over time. For any entrepreneur carrying out social media strategies to promote their blog or business, keeping a log of how your online presence is growing over time is crucial. At the end of every month, you can go to your Twitter Analytics dashboard, make a note of all the stats at the top, and compare them to the previous month.
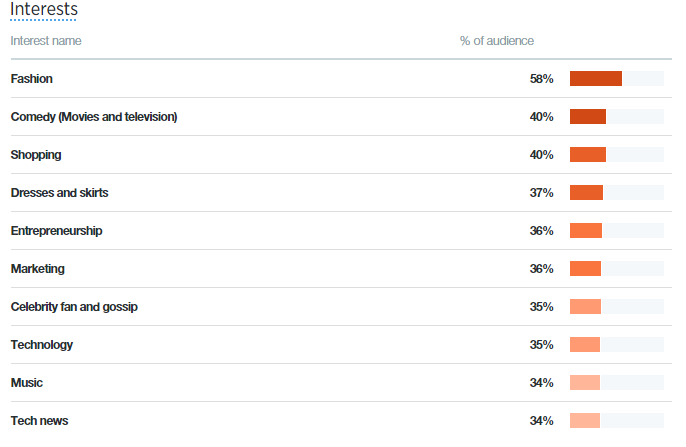
2. The Top 10 Interests of Your Followers
Data behind your tweets is great to have, but data behind your followers is even better. Twitter Analytics shows you the top ten interests of your followers. How it does this is as follows:
“The top interests that distinguish your followers from the Twitter average.”
That quote comes straight from This is great if you’re trying to attract an audience who are interested in certain topics. It also acts as a good guideline for creating social media content and ideas.
 3. Engagement Rate
Twitter Analytics gives you so much information about your engagement rate. It counts engagement anytime someone clicks anywhere on the Tweet, including:
- Link clicks
- Retweets
- Favorites
- Replies
- Follows
- Cards
- Hashtags
- Embedded media
- Tweet expansion
- Profile photo
This column shows you your daily frequency of engagement for all the above. In other words, how many people did something with your tweet when they saw it.
You can also see the breakdown of each individual tweet you post. This works great for tracking which content works the best.
How to find this on your dashboard: log in and go to the Tweets tab. The information you’re looking for is in the right hand column.
4. Bio Word Cloud
Onto Followerwonk now, where one of the best features is the word clouds it generates. There are two – a single and double-word word cloud. These are generated from the biography field of each Twitter user who follows you, to show you the most frequently occurring words in their bio.
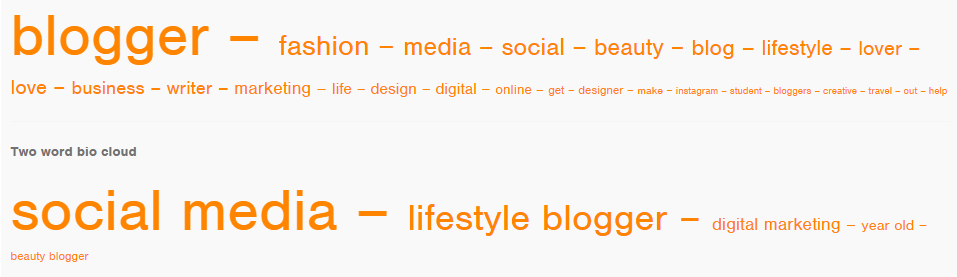
So depending upon your industry, this is great to see who your Twitter content is targeting, and if this is generating conversions – or, if this is making them follow you.
How to find this: Connect your Twitter account to Followerwonk. Go to analyse. Type in your Twitter username in the first box, then change the drop down arrow to “analyse their followers”. Scroll down and you’ll see the word clouds.
Bonus tip: You can also use this tool to follow who your competitors follow – just type their twitter handle into the search bar instead of your own.
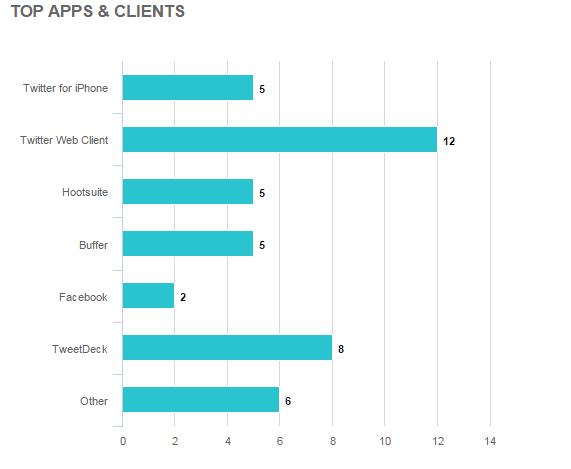
5. Real Time Active Users & How They Use Twitter
A warning in advance – you will become addicted to real time analytics. This shows you two figures that change constantly: the number of active users online and their total number of followers combined. Underneath that, it will show you the profile images of all the people who have tweeted in the last five minutes. It also shows you the top apps that the active followers are using Twitter on.
How to find this: Connect your Twitter account to My Social Bro. Go to the Analytics tab and click on real time analytics.
6. Target Twitter Users
For any business owner or entrepreneur we want to find one thing: customers. Luckily, there’s a simple tool on My Social Bro that helps you do that.
Targeting twitter users allows you to find potential customers to engage with, based on certain characteristics and filters, such as keywords, name, bio and location. You can also pick your criteria of interest, meaning you can really narrow down your search and target your customers directly. Then once you’ve obtained your results, you can pick all the users you want and perform an action for them all in one go.
How to find this: Log in to my Social Bro. Go to the Target tab and click on ‘discover new Twitter users’.
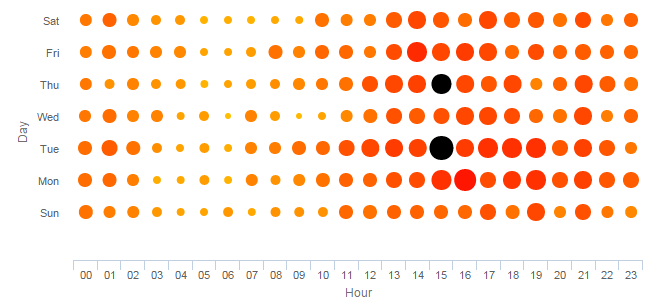
7. The Best Time to Tweet
If you’ve worked on social media for any length of time you’ll know when the best general times are to tweet: in the morning, at lunch, around 5pm (when everyone is going home), and early evening. But it doesn’t have to be as generic as this. Now, you can generate a specific publishing schedule that is catered exactly to when your Twitter followers are most active.
My Social Bro generates a report of 100 of your most active Twitter users that tells you exactly when your community is online the most. Posting tweets on your own specific schedule rather than at general times means your tweets will be more effective. They will reach a larger audience, gain more retweets, replies and follows.
You can then sync this schedule with your Buffer or Hootsuite account, and there you have it – an automatic, posting schedule that is specific to you and your community.
How to find this: On your My Social Bro dashboard, go to Analytics and click on ‘best time to tweet’.
If you are struggling with your strategy for Twitter, you don’t have to. These free tools will help you to gain clear insights into your social media efforts and focus on what works.